One month on and it is surprising to report that the S&P 500 is almost exactly where it was in mid-April, having traded within a 228-point range, a mere nothing after the previous two months.
This pattern of lower volatility and tighter trading ranges repeats throughout the major markets. Meanwhile, credit markets have continued to function well with record sums being raised by companies and 10-year sovereign bond yields steady at the low levels or a shade lower still.
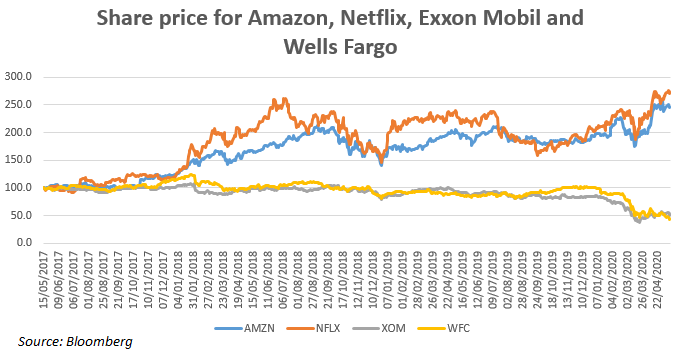
Beneath the surface, at the level of individual stock prices, there has been a lot more volatility. What has been fascinating to see is how many trends in the ‘real world’ have been sped-up by the pandemic and how this has, latterly, been reflected in stock prices. See chart, right, for two of the obvious ‘winners’ from the current malaise against an oil major and a bank, trends that were in place and have accelerated.
It would appear that a number of sectors in the markets offering ‘value’, in the more conventional sense, are over-sold at this stage and there must be bargains to be found. But beware the major trends that are in place and how much the background will be seen to have changed once we emerge from this crisis. Just possibly, the world might get its collective act together and tackle climate change with rather more seriousness at last (possibly straying into over-optimistic territory here).
As before, we do not wish to make any predictions as to the direction of markets over the next three months, they could go anywhere. We are being treated to a cacophony of (usually gloomy) economic soothsaying at the moment at a time when most published economic statistics will be doubtful, backward-looking and likely to be subject to heavy revisions. Better to stand back and consider the risks and likely returns. What does appear to be clear is that longer-dated returns from sovereign bonds are paltry, and therefore high risk for that longer-term, while companies that can grow (and re-invest) their earnings over the next 10/20 years look cheap by comparison.
How would you like to share this?